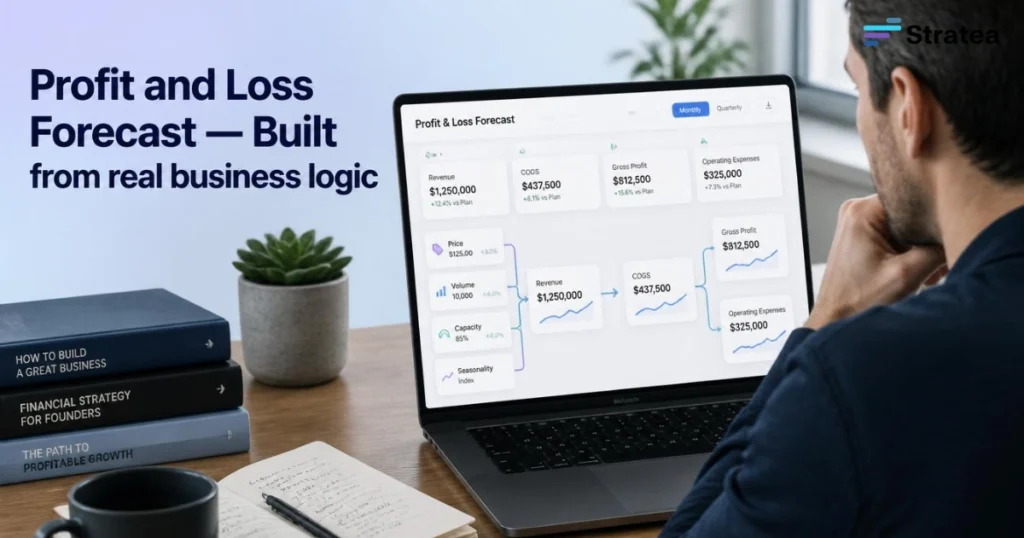
Every business plan needs a financial baseline, and the profit and loss forecast is often its most important component. Built well, it shows how revenue, direct costs, operating expenses, and profit could change over time. stratea.ai can help founders structure the planning process, but the forecast still needs to reflect how the business will actually operate.
A credible profit and loss forecast is not a list of optimistic targets. It is a financial model built from real operating assumptions: how many customers you can reach, how long the sales cycle takes, what each sale costs to deliver, when you need to hire, and where capacity limits appear.
Lenders, investors, and economic-development partners can quickly spot projections that are disconnected from these realities. A five-year revenue goal only becomes believable when it is supported by a clear path through staffing, production or service capacity, pricing, demand, and sales execution. This guide explains how to build a defensible forecast by connecting every important number to the assumptions that drive it.
What Is a Profit and Loss Forecast and Why Do Templates Fail Founders?
A profit and loss forecast, often called a pro forma income statement, summarizes the projected revenues, costs, and expenses of a company over a specific future period. It calculates whether a business will generate a net profit or sustain a net loss. For founders in the United States and Canada, this document proves to external stakeholders that the business model is inherently sustainable over time.
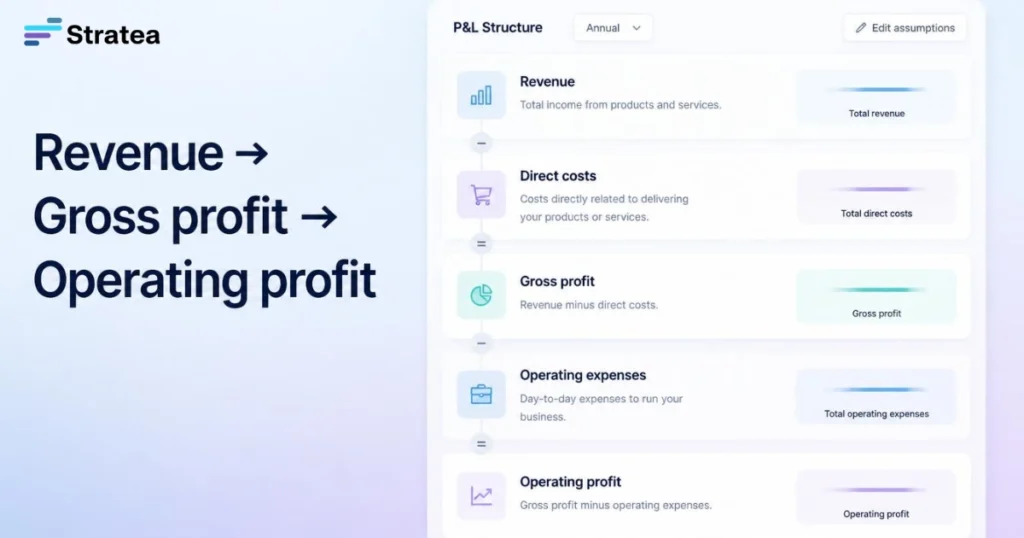
The Core Structural Components of the P&L
To understand the flow of the document, you must look at how it categorizes money moving through the enterprise:
- Gross Revenue: The total value of all goods or services sold before any deductions.
- Cost of Goods Sold (COGS): The direct costs attributable to the production of the goods sold or services delivered.
- Gross Profit: Gross revenue minus COGS, revealing the basic profitability of your core offering.
- Operating Expenses (OpEx): The overhead costs required to run the company that are not tied directly to production, such as rent, administrative salaries, and marketing.
- Net Profit: The final figure after all expenses, taxes, and interest are subtracted from gross profit, indicating the business’s structural profitability.
The Illusion of the Static Spreadsheet Template
Standard financial templates found online often hurt founders more than they help. These documents usually ask you to input a starting revenue figure and apply a uniform monthly growth rate, such as five percent compounded monthly. This method ignores the physical limits of your business.
If your revenue grows five percent every month, does your staff capacity automatically grow with it? Do your suppliers offer volume discounts at specific thresholds? A static spreadsheet hides these operational friction points. A defensible model requires you to link every dollar of revenue directly to the operational actions that produce it.
The Mechanics of Revenue Forecasting: Linking Price, Volume, and Physical Capacity
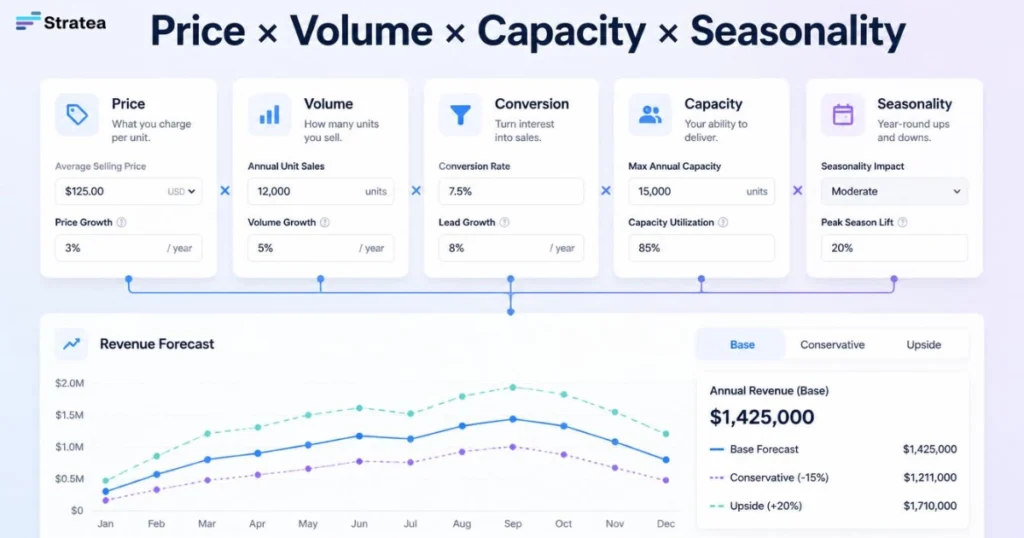
To build a reliable revenue model, you must move away from macro-market assumptions. Saying your company will capture one percent of a ten-billion-dollar market is a placeholder, not a plan. Instead, your revenue projections should rely on specific, verifiable operational inputs.
Defining Your Revenue Engine Units
Your revenue engine should be broken down into its smallest moving parts. If you operate an e-commerce brand, your revenue is determined by website traffic, conversion rate, and average order value. If you run a professional consulting firm or a healthcare clinic, your revenue is determined by billable hours, available clinicians, and average hourly rates.
Revenue = (Acquisition Input × Conversion Rate) × Average Transaction Value
By structuring your model around these distinct levers, you can test how a shift in one metric impacts the entire forecast. If customer acquisition costs rise in your regional market, you can immediately see the downward pressure on your net margins.
Factoring in Structural and Human Capacity Constraints
Every business hits a physical ceiling before it can reach the next tier of scale. You cannot forecast revenue growth that exceeds what your current team, equipment, or facility can physically produce.
Consider a specialized regional manufacturing plant or a service business. If one service vehicle and crew can complete a maximum of four service calls per day, your revenue for that unit is strictly capped at twenty calls per week. To grow revenue beyond that ceiling, your profit and loss forecast must simultaneously show a capital expenditure or a step-up in fixed costs to acquire another vehicle and hire another crew.
Modeling Expenses: Distinguishing Variable Cost of Goods Sold from Step-Cost Fixed Expenses
An accurate forecast requires a strict understanding of how your expenses behave when your business volume changes. Grouping all expenses into a single overhead category will cause you to miscalculate your break-even point.
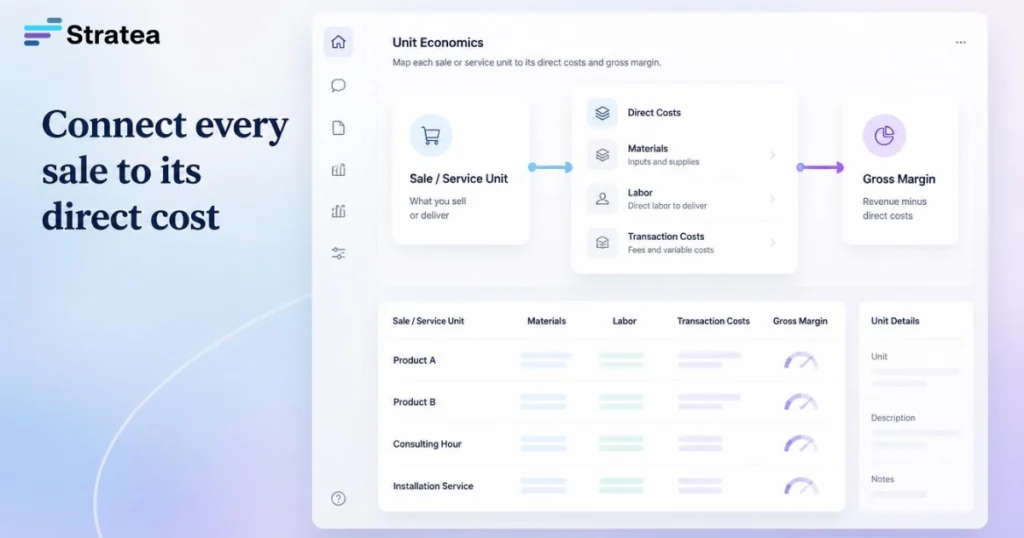
Mapping Direct Costs to Gross Margin
Your gross margin percentage is a clear indicator of operational health. It shows how much room you have to cover your overhead and reinvest in growth. To keep this metric accurate, every direct cost must be captured inside COGS:
- Direct labor costs, including hourly wages for production workers or field technicians.
- Raw materials and inventory shipping fees.
- Merchant account processing fees for credit card transactions.
- Third party software licenses allocated directly to delivering a client service.
If your gross margin is too thin, minor fluctuations in material costs or labor rates can push your entire operation into a deficit.
Structuring Operating Expenses and Step-Costs
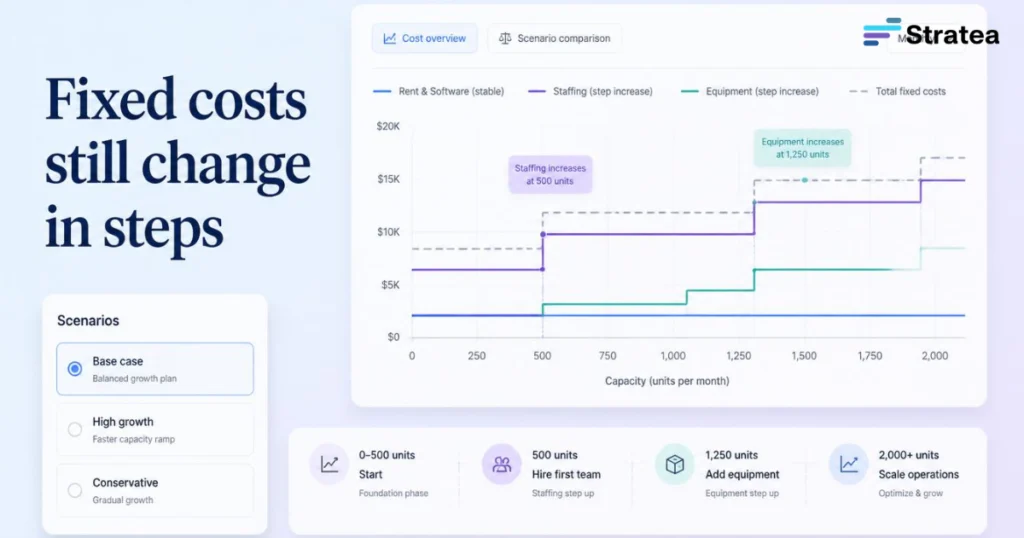
Operating expenses are often described as fixed costs, but they are rarely completely fixed over a multi-year horizon. Instead, they behave like steps.
For example, a subscription software platform might pay a flat fee for hosting up to ten thousand active users. The moment the ten-thousandth-and-first user signs up, the hosting cost steps up to the next tier. Administrative staff, office space, and insurance premiums follow this same pattern. Your financial model must explicitly outline these triggers so that your expense lines jump appropriately when volume thresholds are crossed.
The Divergence: Why a Healthy Profit and Loss Forecast Can Still Lead to Bankruptcy
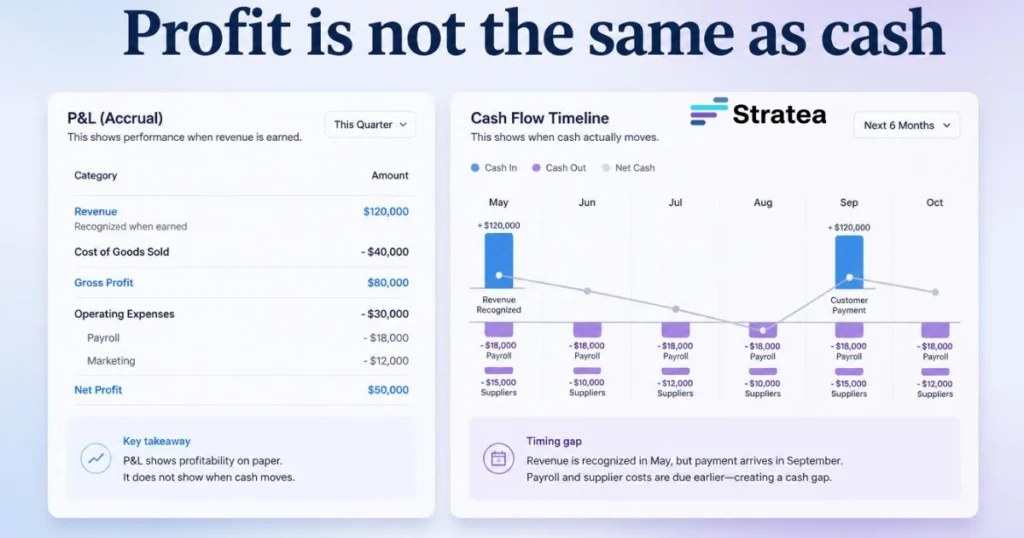
A common point of confusion for early-stage founders is how a company can show an impressive net profit on paper while simultaneously running out of money. The profit and loss forecast measures structural profitability, but it does not measure day to day survival.
The Timing Gap Between Profit Recognition and Cash Flow
Under standard accounting rules used across the United States and Canada, revenue is recognized when the service is delivered or the product is shipped, not when the customer pays the bill. This creates a dangerous timing gap.
If you secure a major corporate contract worth fifty thousand dollars in October, your profit and loss statement shows fifty thousand dollars in revenue for October. However, if that corporate client operates on a net-sixty payment schedule, you will not receive that cash until December. During October and November, you must still pay your employees, your rent, and your suppliers out of your existing reserves.
Scenario Planning for Seasonality and Collection Lags
To prevent unexpected cash crunches, your planning process should include a clear dependency map. When your volume assumptions change, you need to track how that change cascades through your operational requirements.
| Operational Shift | Direct Financial Impact | Impact on Capital and Cash Timing |
| High Season Volume Surge | Increased Gross Revenue, Higher Raw Material Costs | Immediate cash outflow for inventory; collections lag by 30 to 60 days. |
| Crew/Capacity Limit Reached | Plateaued Revenue Growth | Requires immediate step-up in fixed overhead for equipment or new hires. |
| Corporate Client Mix Shift | Higher Contract Value, Lower Per-Unit Transaction Cost | Working capital strain increases due to longer institutional payment terms. |
Worked Example: Building a Financial Forecast for Blade and Branch Landscaping
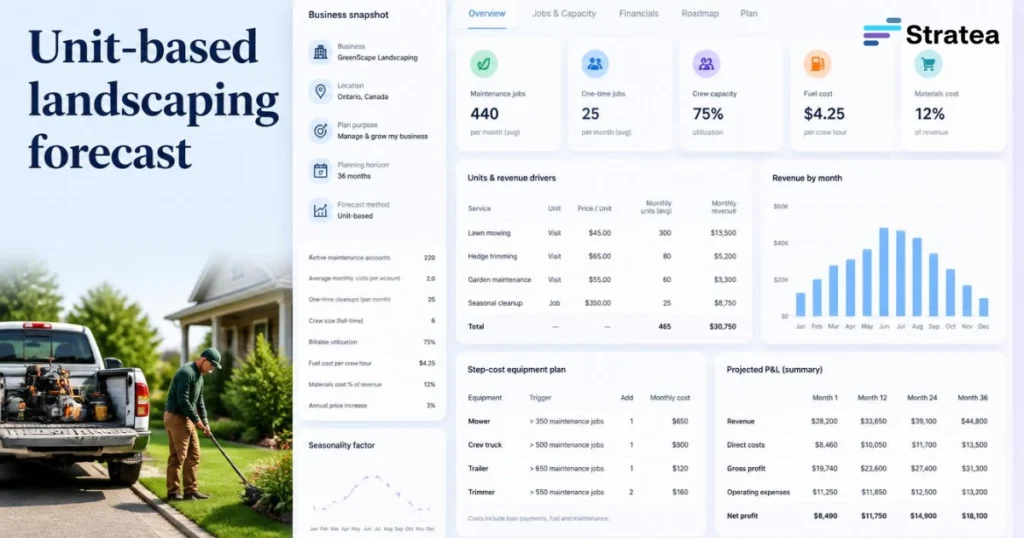
To see these financial principles in action, let us review a regional service business: Blade and Branch Landscaping. The company provides commercial property maintenance and residential design-build services across a northern territory, making it subject to distinct seasonal changes.
Instead of downloading a generic template and guessing at a ten percent monthly growth rate, the leadership team builds their profit and loss forecast based on clear operational parameters.
Step 1: Establish Unit-Based Revenue Logic
The team defines their primary revenue unit as a standard maintenance crew consisting of three field technicians and one fully equipped truck.
- Capacity: One crew can service a maximum of 30 commercial accounts per week during the 32-week active landscaping season.
- Pricing: The average contract value per account is $350 per month.
- Maximum Crew Capacity: A single crew can generate up to $10,500 per month in gross revenue.
Step 2: Map Variable Direct Costs (COGS)
To calculate an authentic gross profit, Blade and Branch assigns all direct expenses to COGS:
- Direct Labor: Three technicians earning $22 per hour for 40 hours per week ($2,640 per week total).
- Fuel and Direct Consumables: $450 per week per truck.
- Disposal Fees: $150 per week.
This brings the total direct cost of operating one crew to $3,240 per week, or roughly $12,960 for a four-week operating month. The model shows that a crew must maintain a specific utilization rate just to cover its own direct deployment costs.
Step 3: Layer in Seasonal Realities and Step-Costs
Because Blade and Branch operates in a region with cold winters, their main landscaping revenue drops significantly between November and March. The team adjusts their winter profit and loss lines by shifting their revenue engine to commercial snow removal services, which carry different pricing structures, lower labor utilization requirements, and higher specialized insurance premiums.
When the forecast shows the company reaching 60 active commercial accounts in year two, the model automatically triggers a step-cost. The business must purchase a second truck ($45,000 capital expenditure) and hire a second full-time crew, which temporarily lowers their net margin until the new capacity is fully utilized.
By building the forecast around these physical constraints, Blade and Branch can present a financial plan to local commercial lenders that clearly justifies the loan amount they are requesting.
Comparison: How Different Planning Approaches Handle Financial Logic
When structuring your financial projections, the method you choose determines the quality of your strategic insights.
| Planning Approach | How Revenue Is Forecasted | How Expenses Are Modeled | Usefulness for External Review |
| Top-Down Template Fill | Arbitrary market-share percentage or blanket growth targets. | Standard flat percentages applied uniformly across all categories. | Low: Lenders and investors quickly spot the lack of operational logic. |
| Traditional Spreadsheet Build | Custom formulas linking volume to historical performance data. | Granular separation of variable and fixed costs, built manually. | High: Extremely thorough, but prone to broken cell links and slow to update. |
| STRATEA Guided Discovery | Input variables processed via systematic operational questioning. | Cost behaviors and structural constraints mapped dynamically to capacity. | High: Produces a clear financial narrative backed by explicit logic. |
Questions to Answer Before Submitting Your Projections to Lenders or Investors
Before you hand your financial projections over to an external reviewer, you must ensure you can defend the underlying assumptions. Reviewers rarely care about the final numbers on their own, they care about the logic used to reach them. Ask yourself the following questions:
- What operational trigger requires you to add your next three full-time employees? You must be able to point to the exact volume threshold where your current team can no longer handle the workflow.
- How does your gross margin change as your purchasing volume increases? If you claim your margins will improve over time, show the specific vendor price breaks or production efficiencies that make it possible.
- What happens to your cash runway if your largest clients delay payments by an extra 30 days? A reliable plan shows that the business can survive normal collection variations without going under.
- Are your customer acquisition costs tied logically to your marketing spend? If you scale back your marketing budget in your forecast, your customer acquisition numbers should reflect that drop.
What makes STRATEA different?
Rather than functioning as a standard form-fill template or a quick document writer, STRATEA uses a dedicated Strategic Discovery Process to build your business plan. The platform serves as an AI Planning Assistant that asks targeted questions about your operational limits, service pricing models, and resource capacity constraints. This guided workflow helps you move away from arbitrary percentages and focus on creating a financial plan you can defend before an investor or loan officer reviews your numbers.
If you want to move past generic formulas and structure your financials around actual operational logic, you can explore the financial guide resources or begin refining your numbers directly. Bring your current operating ideas into STRATEA and see which parts of your financial plan require clearer structural support before you present them to external partners. It is free to start your guided planning process, allowing you to build out your core operational milestones before deciding to access advanced structuring features.
FAQ
What is the difference between a profit and loss forecast and a budget?
A profit and loss forecast projects the long term revenue and expense performance of a company based on its operational capacity and strategic goals. A budget is a specific, shorter term operational tool used to control spending and allocate resources across departments based on those projections.
How far out should a startup’s financial projections go?
Most lenders and investors expect a three-year monthly projection, with some requesting a five-year model for asset-heavy or highly capital-intensive industries. Years four and five are understood to be directional, but the first 24 months must reflect precise operational logic.
How do I estimate expenses if my business has no operating history?
Look to regional industry averages, get direct quotes from insurance providers and suppliers, and look closely at standard labor costs in your target market. Treat these initial numbers as clear assumptions that you will update with real operational data as soon as you launch.
Why do investors care more about the gross margin than net profit in early-stage plans?
Gross margin reveals whether your product or service is structurally viable. If your gross margin is weak, the business cannot generate enough capital to support growth or cover basic overhead, no matter how much you scale your top-line revenue.