

A startup financial model is not a crystal ball. It’s a structured way to test whether your business assumptions make sense together. A good model forces you to answer hard questions: How many customers do you actually need? When will you run out of cash? What would change if your customer acquisition cost doubled?
Most startup founders avoid building a financial model because they think it requires predicting the future accurately. It doesn’t. A financial model’s real value, much like the rest of your ai business plan generator, is making assumptions visible so you can test them, improve them, and explain them to lenders or investors.

What a Startup Financial Model Actually Is
A startup financial model is a set of linked spreadsheets (or planning documents) that show how revenue, costs, and cash flow work together in your business. It answers three core questions:
- How will we make money? This is your revenue model. You specify price, customer volume, conversion rates, and how they connect to your go-to-market effort.
- What will it cost to operate? This is your cost structure. You identify fixed costs (rent, salaries), variable costs (materials, fulfillment), and when you’ll need to add capacity (hire staff, buy equipment).
- When will we run out of cash? This is your cash flow forecast. Even if you’re on track to be profitable on paper, if cash comes in after you’ve spent it, you’ll hit a wall.
A financial model is not:
- A prediction of the future (you can’t predict the future)
- An Excel spreadsheet that makes numbers look impressive (simplicity beats polish)
- A guarantee to lenders or investors (it’s a starting point for conversation)
- A one-time deliverable (it should update as you learn)
Instead, a financial model is a decision tool. It shows the logic of your business. When you explain your model to a lender, they’re not asking you to be right; they’re asking you to show that you’ve thought through the assumptions.

The Three Core Components of a Startup Financial Model
A startup financial model has three interconnected pieces. They feed into each other, and if one is weak, the whole model breaks down.

Revenue Drivers: Price, Volume, and Conversion
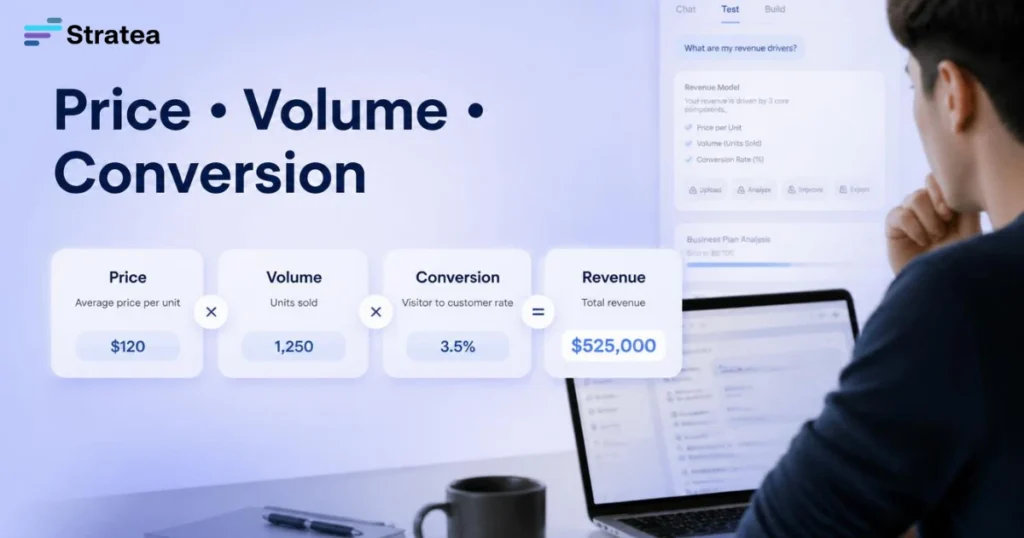
Revenue isn’t a number you guess. It’s the product of three decisions: how much you charge, how many customers you can reach, and what percentage of those will actually buy.
Price: How much will a customer pay for what you offer? If you’re selling a product, this is straightforward. If you’re selling a service, you may charge by the hour, by the project, or by the outcome. The price must cover your costs and give you margin.
Volume: How many potential customers exist in your market, and how many can you realistically reach in the next 12 months? Don’t guess at “total addressable market.” Instead, ask: How many customers can I get to with the marketing budget I have? What’s the cost to reach one customer?
Conversion: Of the people you reach, what percentage will actually buy? If you’re testing different channels (email, ads, referrals, direct sales), each channel has its own conversion rate. A good model breaks revenue out by channel, not as one lump sum.
Revenue = (Customers reached) × (Conversion rate) × (Price per customer)
That’s it. Everything else is nailing down the details of those three numbers.
Operating Costs: Fixed Costs, Variable Costs, and Scaling
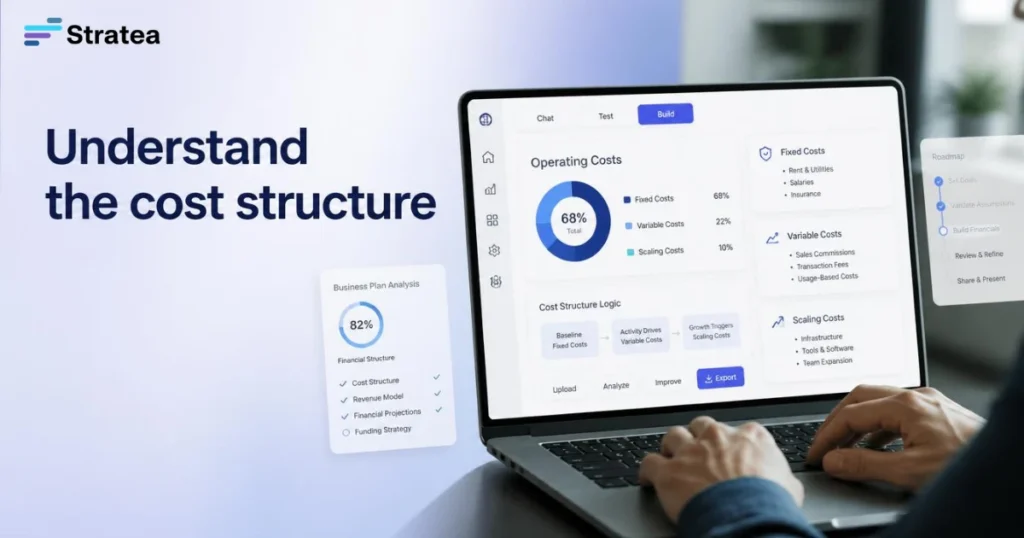
Your costs fall into two categories, and they behave very differently as you grow.
Fixed costs are what you pay whether revenue is zero or $100,000. Examples: office rent, full-time salaries, software subscriptions, insurance. These stay the same month to month until you hit a scaling point (add another office, hire another person).
Variable costs scale directly with revenue. If you’re selling a product, the cost of materials, packaging, and shipping scales with each unit sold. If you’re selling a service, the cost of labor to deliver that service scales with each customer.
The key insight: Your gross margin (price minus variable cost per unit) needs to be high enough to cover your fixed costs and leave you with profit. If your gross margin is 30% and your fixed costs are $10,000 per month, you need at least $33,000 in revenue just to break even.
Most founders get this wrong because they either ignore fixed costs or don’t account for when they’ll need to increase capacity.
Cash Flow: When Money Comes In and When It Goes Out
Revenue and profit are not the same as cash. A profitable business can still run out of cash if money comes in too slowly.
Example: You sell a service for $5,000, and it costs you $2,000 to deliver. You have a $3,000 profit margin. But if you have to pay your team $2,000 upfront before the customer pays you, you need $2,000 in the bank to start. If you take on 10 customers simultaneously, you need $20,000 in cash before you see any revenue. That’s a cash flow problem, not a profitability problem.
Cash flow tracking answers: When do you spend money, and when does money come back in? Build a month-by-month or week-by-week forecast (depending on how fast your business moves) showing:
- Cash in: When customers pay you
- Cash out: When you pay expenses, payroll, vendors
- Net cash position: Do you have cash left at the end of the month, or are you drawing down reserves?
Without this, you’ll be surprised by a cash crunch even though you’re “making money.”

Why Assumptions Matter More Than Projections
A lot of founders build financial models with incorrect assumptions, then treat the resulting numbers as fact.
Here’s the problem: If your assumption is wrong, the whole model is wrong. And you won’t know the assumption is wrong until you test it in the real world.
For example, assume you’re building a model for a SaaS product:
- You assume 100 people will sign up in Month 1
- You assume 3% will convert to paying customers (3 customers)
- You assume they’ll stay for 6 months on average
- You assume you’ll charge $100/month
From these assumptions, you project $1,800 in Year 1 revenue from Month 1 cohort alone.
But what if only 10 people try your product? What if conversion is 1%? What if customers stay for 2 months? Then Month 1 revenue is more like $200. Your model breaks down not because math is wrong, but because assumptions were wrong.
The real value of a financial model is forcing you to state these assumptions clearly. Then you can test them:
- Can you actually reach 100 people?
- Is 3% conversion realistic for your product?
- Will customers really stay for 6 months?
A good financial model makes it easy to update numbers as you learn. Instead of building one big projection, you’re testing assumptions in sequence.

Building a Revenue Model from Real Numbers
A lot of founders build revenue projections from thin air. They pick a number and work backward. Instead, build revenue from the ground up, starting with real numbers you can test.

Pricing Logic: What Will Customers Actually Pay?
Pricing is a business decision, not a random number. Ask yourself:
- What problem does my product solve?
- What’s it worth to a customer to solve that problem?
- What are alternatives, and what do they cost?
- What price makes sense given my cost structure?
For a service business, you might charge hourly ($50-$200/hour, depending on expertise). For a product, you might charge per unit ($10-$100, depending on value). For a subscription, you might charge monthly ($20-$500+, depending on value).
The point: Your price must be defensible. You should be able to explain why you’re charging what you’re charging, not just pick a number that “sounds good.”

Customer Acquisition: How Many Customers Can You Reach?
Don’t start with “my target market is 10 million people.” Start with channels.
- Direct sales: How many prospects can you personally contact and close in a month? Multiply by 12.
- Content/SEO: How much traffic can you realistically drive in 12 months? What’s the conversion rate to customer?
- Paid ads: How much budget do you have for ads, and what’s the cost per customer? Customers = Budget / Cost per customer.
- Referrals: How many customers are likely to refer someone? What percentage of referrals convert?
Each channel has a different cost, conversion rate, and scale limit. Build revenue by channel first, then add them together.

Volume and Conversion: Translating Effort Into Revenue
Once you’ve estimated reach and conversion by channel, you have revenue. But make sure the numbers are defensible.
If you’re acquiring customers through paid ads at $50 per customer, and you want 100 customers, you need $5,000 in ad budget. Is that realistic? Can you afford it?
If you’re relying on referrals for 50% of revenue, and you don’t have any customers yet to refer, is that realistic in the first 6 months?
Push back on your own assumptions. Build them from real numbers (cost per ad click, historical conversion rates, your own sales experience), not from generic benchmarks.
Mapping Operating Costs to Business Decisions
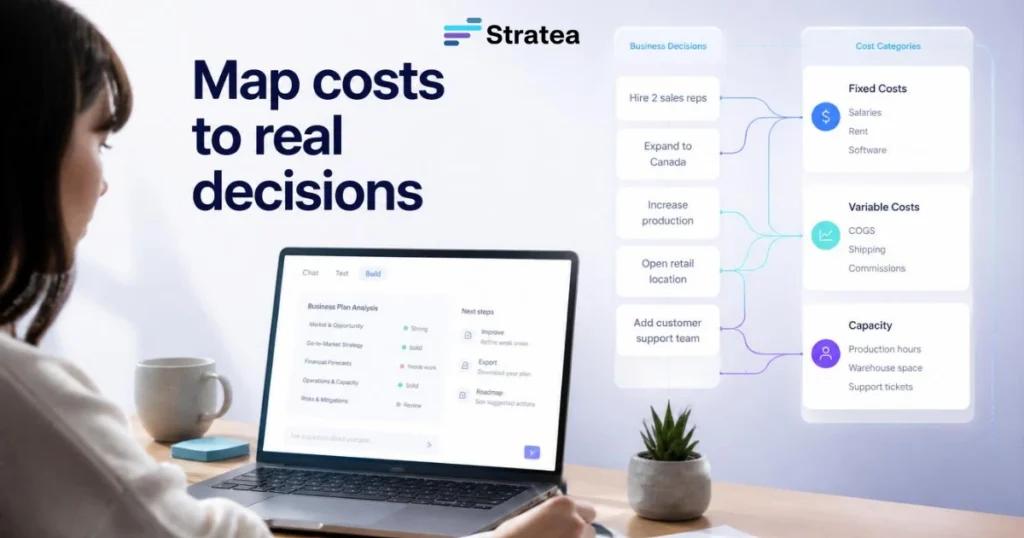
Your costs should reflect the decisions you’re actually making about how to run your business. Don’t just list expenses; connect them to why the expense exists.
Fixed Costs: What You Pay Whether Revenue Is Zero or $100k
These are your survival costs. They’re the minimum your business needs to operate.
Examples:
- Salary for you (the founder) or a key employee
- Office or workspace rent
- Essential software (accounting, CRM, payment processing)
- Insurance
- Legal and accounting services
Add them up. This is your “burn rate,” the amount you need to cover each month even if you sell nothing. If your fixed costs are $8,000/month and you have $50,000 in savings, you have roughly six months of runway (assuming no revenue).
Variable Costs: What Scales Directly with Sales
These are costs that go up as you sell more.
Examples:
- Materials or inventory (if you sell a product)
- Labor to deliver the service (if you sell a service)
- Fulfillment, shipping, packaging
- Payment processing fees
- Customer support costs (email, chat, ticketing software)
Calculate your variable cost per unit. If a unit costs $20 to produce and deliver, and you sell it for $100, your gross margin is $80. That $80 needs to cover fixed costs and profit.
The Scaling Decision: When to Add Capacity
As you grow, you’ll need to add capacity. This is where planning gets real.
Maybe you can handle 10 customers as a solo founder. At 11 customers, you need to hire help. Or if you’re selling a product and hit 1,000 units, you need better fulfillment.
Every capacity decision (hiring, equipment, infrastructure) is a fixed cost jump. It changes your break-even point.
Build a plan that shows: At what revenue level do you hire the next person? At what point do you upgrade your software? When do you need better equipment?
These decisions cascade through your model. Adding a $50,000 salary for a new hire means you need an extra $50,000 in revenue just to stay break-even.
Worked Example: Mobile Landscaping Services
Let’s build a financial model for a mobile landscaping startup, GreenCrew Landscaping.
GreenCrew offers lawn care, landscaping, and landscape maintenance for residential customers in a mid-size suburban market. The founder, Jordan, is starting solo and planning to hire crews as volume grows.
Building the Revenue Model
Pricing: GreenCrew charges $80 per lawn per visit for maintenance (monthly visits, 4 per year average), and $150-$500 for bigger projects (mulch, sod, design).
Year 1 focus: lawn maintenance, not projects. Simpler, recurring, easier to forecast.
Customer acquisition: Jordan will use:
- Door-to-door outreach: Can contact 10 neighborhoods, 30-40 homes per neighborhood, 1% conversion in Year 1 = 30-40 customers
- Local Facebook ads: $500/month budget, $20 cost per customer, = 25 customers per month (ramping up as brand awareness grows)
- Referrals: Each satisfied customer refers 1 new customer on average (Year 1 target: 20 referrals)
Month 1 revenue: Let’s say 15 customers (early stage, ramping up)
- 15 customers × $80 × 1 visit in Month 1 (ramping) = $1,200
By Month 12, Jordan projects 100 recurring customers, at 4 visits per year average.
- 100 customers × $80 × 4 visits / 12 months = ~$2,667/month recurring
Plus project revenue (estimate 2-3 projects per month, average $300 each): $600-$900/month
Year 1 revenue estimate: $1,200 Month 1, ramping to $3,300/month by Month 12. Rough total: $25,000.
This is built from real numbers (door-to-door contacts, ad spend, visit frequency), not guesses.
Mapping Operating Costs and Crew Scaling
Fixed costs (Jordan solo):
- Jordan’s salary: $3,000/month (keeping it lean)
- Vehicle (lease/payment): $400/month
- Gas, equipment, supplies: $300/month
- Insurance, license, permits: $200/month
- Software (scheduling, invoicing): $50/month
- Total fixed costs: $3,950/month
Variable costs (per customer):
- Labor: Jordan does the work, no variable labor cost yet
- Materials (mulch, etc.): ~$5 per visit, included in pricing
Scaling decision: At 60 customers, Jordan can’t service them alone. Needs to hire a crew.
- Adding one crew member: +$2,500/month salary
- This increases fixed costs to $6,450/month
- New break-even: ~81 customers (6,450 / 80 = 81 customers for break-even)
By Month 12, Jordan projects 100 customers, so hiring before Month 12 makes sense (around Month 8-9).
Cash Flow Reality: Why Timing Matters More Than Total Profit
Here’s where Year 1 gets real.
Jordan starts with $15,000 in savings.
Fixed costs are $3,950/month. Even with zero revenue in Month 1, Jordan burns $3,950.
Revenue ramps (Month 1: $1,200, Month 2: $2,000, Month 3: $2,500, etc.). But until revenue exceeds fixed costs, Jordan is drawing down savings.
Break-even: Fixed costs ($3,950) / Margin per customer ($80) = ~50 customers needed to break even.
But it takes time to reach 50 customers. If Jordan hits 50 customers by Month 8, they’ll have burned through $15,000 in savings by Month 5-6 and run out of cash.
Solution: Jordan needs either:
- More starting capital ($25,000+ to cover fixed costs while ramping customers)
- Lower fixed costs (maybe a part-time crew, not a full hire; shared vehicle; lower personal salary)
- Faster customer acquisition (more aggressive marketing, higher conversion)
This is what a cash flow forecast reveals. Profitability on paper (you’re making money) isn’t the same as having cash in the bank.
A good financial model makes this visible upfront so Jordan can plan accordingly.

Mobile landscaping financial model
Common Assumptions Founders Get Wrong
Founders tend to make the same mistakes when building financial models.
Mistake 1: Inflated customer acquisition numbers. Founders assume they can reach 1,000 customers in Year 1 when they have no brand, no track record, and no marketing budget. Build from channels and real conversion rates, not hope.
Mistake 2: Ignoring the gap between revenue and cash flow. Founders build a model showing profitability in Month 6, then run out of cash in Month 3 because customers pay late or they have to buy inventory upfront.
Mistake 3: Treating fixed costs as variable. Founders assume they can keep payroll at 20% of revenue forever. In reality, at 20% of revenue in Month 1, payroll is 100% of revenue. Fixed costs only become “small” at scale.
Mistake 4: Not updating assumptions when reality changes. Founders build a model, treat it as gospel, and ignore when actual numbers diverge. A good model is a living document; you update it as you learn.
Mistake 5: Assuming price and volume are independent. Founders build a model with low price and high volume, or high price and low volume, without testing if both are realistic together. A good model shows the trade-offs.
Building Financial Scenarios, Not Predictions
A startup financial model should show multiple scenarios, not a single “prediction.”
Build three scenarios:
- Conservative: What if customer acquisition is 50% slower than you plan? What if conversion rates drop? What’s the minimum you need to survive?
- Base case: Your best estimate of what will happen based on real numbers and testing so far.
- Upside: What if customer acquisition is 50% faster? What if word-of-mouth takes off? What’s the best plausible outcome?
Each scenario changes the model. Lenders want to see you’ve thought through downside risks. Investors want to see you’ve explored upside. But the base case is what matters operationally—that’s what you should plan around.
| Scenario | Year 1 Customers | Year 1 Revenue | Cash Requirement | Hire Timeline |
| Conservative | 40 | $15,000 | $25,000 | Month 10+ |
| Base Case | 100 | $40,000 | $18,000 | Month 8 |
| Upside | 150 | $60,000 | $15,000 | Month 6 |
This kind of scenario planning is way more valuable than a single predicted number.
What Makes STRATEA Different?
STRATEA helps you organize financial assumptions so the logic is transparent and testable. Instead of handing you a template full of placeholder numbers, STRATEA asks: What’s your price? How many customers can you realistically reach? When will you need to hire? As you answer, STRATEA connects your assumptions to revenue, costs, and cash flow. If an assumption changes, the model updates. You’re not predicting the future; you’re making your business logic visible so you can test it, defend it, and improve it as you learn.
FAQ
Q: How far into the future should a startup financial model project?
A: If you’re raising funding, investors typically want to see 3-5 years. For your own planning, 12-24 months is more useful because assumptions get too uncertain beyond that. Build 12 months of detail, then rough out years 2-3 to show trajectory. Update the model quarterly as you learn.
Q: What if I don’t have historical data yet? How do I estimate customer acquisition?
A: Use benchmarks from similar businesses in your space, but adjust for your specific situation. If industry average CAC is $50, but you’re a solo founder without a brand, assume $100+ until you prove otherwise. Build the model with conservative assumptions, then test and update as you get real data.
Q: Should I include taxes, depreciation, and other accounting details in my startup financial model?
A: For a founder planning model, no. Focus on cash flow and operating profit. Leave taxes, depreciation, and formal accounting to your accountant. A planning model should be simple enough to update quickly as you learn.
Q: What’s the difference between a financial model and a cash flow forecast?
A: A cash flow forecast is the output of a financial model. A financial model shows revenue drivers, costs, and assumptions. The cash flow forecast is the month-by-month result showing when you run out of money.
Q: How often should I update my startup financial model?
A: Update it quarterly, or whenever a major assumption changes. If your customer acquisition cost is 50% higher than you modeled, update the model. If you lose a major customer or hire early, update the model. Don’t let it become out of date.
Q: Can I use a financial model I found online as a template?
A: Yes, but customize it heavily. Generic templates often include sections you don’t need and miss specifics of your business. Use a template as a starting point, then build your own logic. The model only works if you understand every assumption in it.
Next Steps
A startup financial model doesn’t need to be complex. It needs to be clear.
Start by answering three questions:
- How many customers can I realistically reach, and at what price? (Revenue)
- What will it cost me to operate and deliver? (Costs)
- When will I run out of cash, and how much money do I need? (Cash flow)
Use STRATEA to organize your thinking. Start Strategic Discovery free, and work through your assumptions. As you go, STRATEA helps you organize those assumptions into a model that connects your business narrative to actual numbers.
The goal isn’t a beautiful spreadsheet. It’s clarity about the logic of your business. Build a model you can explain and update as you learn.