
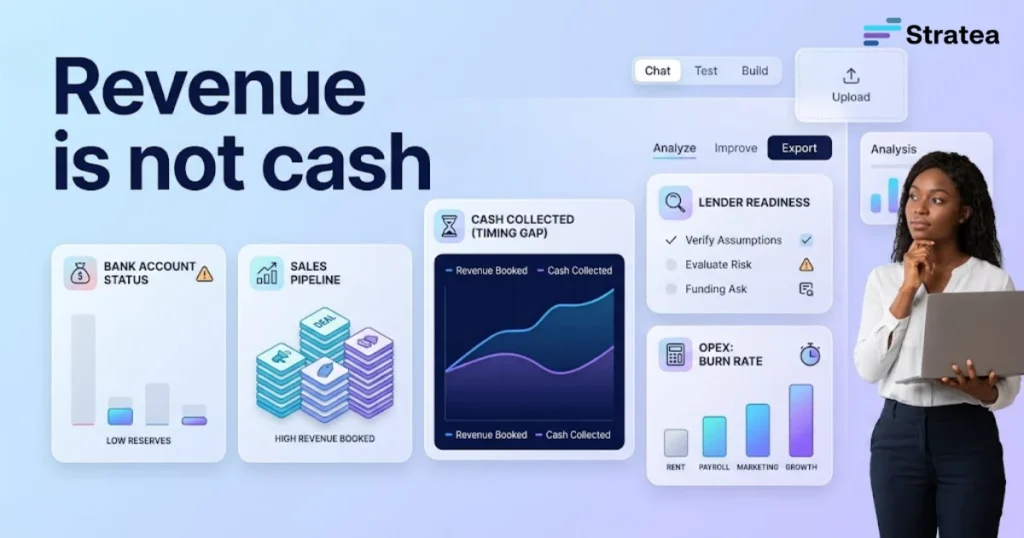
A high-growth sales pipeline is not the same thing as cash. Founders often build strong revenue curves in a spreadsheet, then run short on liquid capital while the books still show a profit. A balance sheet cannot pay your manufacturing facility, your warehousing staff, or your advertising vendors on the first of the month.
A cash flow forecast should not be a document that sits in a shared drive after an investor meeting. It is a working map of your business operations. Whether you build it by hand or start from an ai business plan, this guide shows how to structure your assumptions, reconcile the timing gap between sales and collections, and build a model that holds up to review from bank lenders and investors.
Beyond the spreadsheet: what a cash flow forecast actually shows
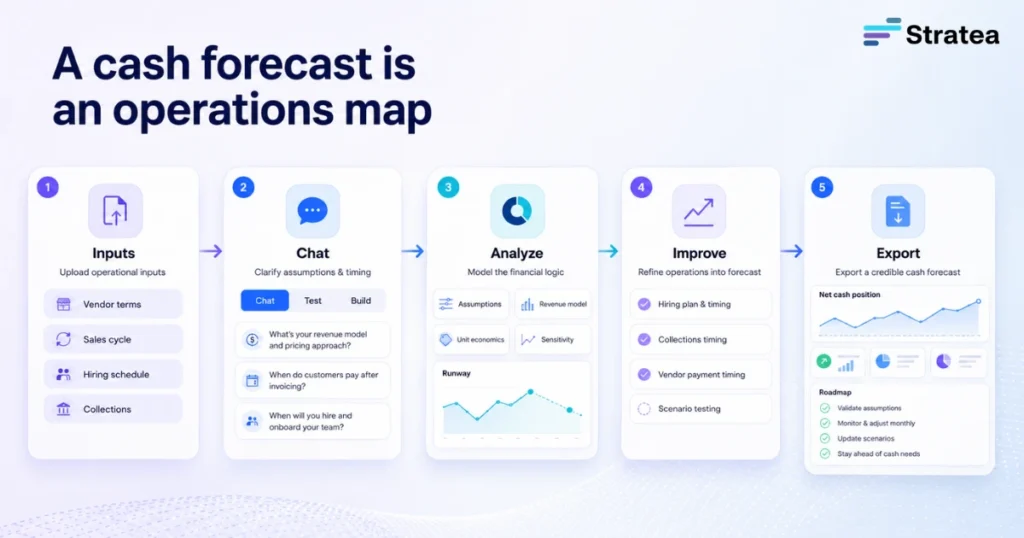
A cash flow forecast is a mathematical reflection of your operational choices. It translates your vendor terms, sales cycles and hiring schedule into a timeline of inflows and outflows. A forecast built on an arbitrary month-over-month growth rate is a guess, not a plan. A defensible model relies on operational drivers that can be tracked, measured and adjusted as real results come in.
Cash vs. profit: the timing trap
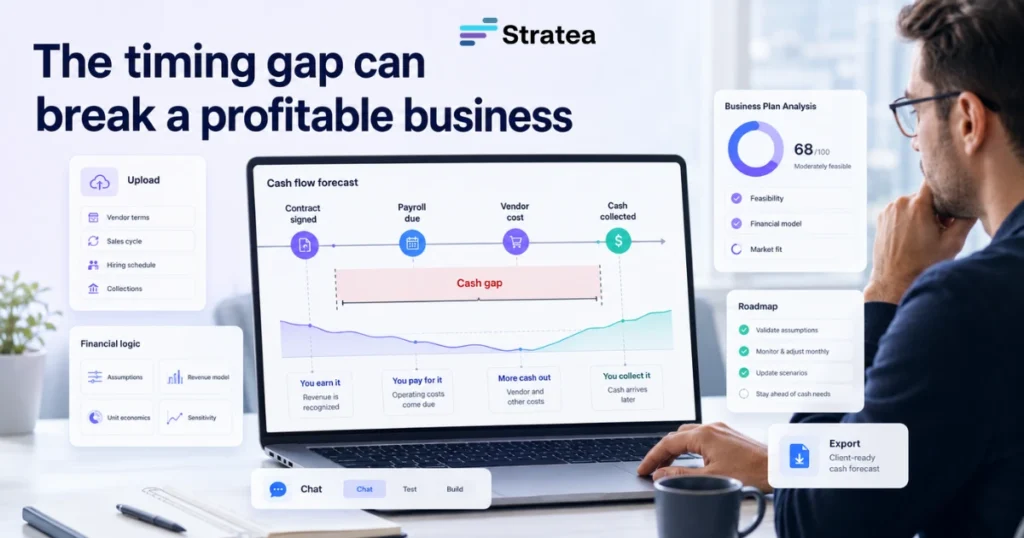
Most cash problems come from the gap between when revenue is recognized and when cash is actually collected. Under standard accrual accounting, a sale is recorded when the contract is signed or the product ships. If your software agency signs a $50,000 client on net-60 terms, your profit and loss statement shows a $50,000 gain immediately.
Your bank account does not move. For the next 60 days, you still have to fund payroll for the engineers on the project, pay for infrastructure and cover office overhead. Sign three more clients on the same terms at once, and paper profitability climbs while liquid cash keeps dropping. It is possible to face a cash shortfall before the first invoice clears.
The anatomy of a cash flow position
To avoid this timing trap, separate cash movements into three clear buckets:
Operating Cash Flow + Investing Cash Flow + Financing Cash Flow = Net Cash Position
Operating cash flow: the net capital generated or consumed by daily core business activity. This includes customer collections minus payments to suppliers, payroll and marketing costs.
Investing cash flow: capital spent on long-term assets, such as lab equipment, fleet vehicles or manufacturing machinery that depreciates over several years.
Financing cash flow: capital flowing into or out of the business from external sources, including loan disbursements, principal repayments, equity injections and lines of credit.
Separating these flows gives you a clearer read on sustainability. A company can look healthy because it holds a large cash balance while actually burning cash operationally and surviving on a temporary loan.

Building the revenue architecture: price, volume and conversion
A defensible model builds the revenue forecast from the bottom up, using transparent, driver-based variables. This replaces a top-down claim such as “we will capture 1% of a $10B market” with specific, verifiable inputs.
Unit-driven revenue modeling
To model revenue cleanly, define the units that create economic value. For an e-commerce or manufacturing brand, this is order volume multiplied by average order value (AOV). For a B2B service or SaaS firm, it is the active client roster multiplied by monthly recurring revenue (MRR) per contract, adjusted for expected churn.
Break your customer acquisition funnel into separate components:
Inbound performance: monthly organic and paid traffic multiplied by your web conversion rate gives your gross transactional volume.
Outbound pipeline: weekly outbound prospecting or email volume multiplied by your discovery-call book rate, then by your close rate, gives your new enterprise contracts.
If your historical performance shows a 2 percent web conversion rate, use 2 percent as your baseline. If you plan to model 4 percent next year, the narrative should explain the shift with specific product or marketing changes.
Factoring in sales velocity and cycle delays
Once you know the volume of new business, map the sales velocity: the time it takes a prospect to move from initial contact to settled cash.
Sales Velocity = (Leads × Average Deal Value × Win Rate) ÷ Sales Cycle Length
In enterprise sales, a deal may involve a six-month cycle with multiple technical evaluations and procurement steps. Even after the contract is signed, the client’s internal accounting process might add another 30 to 45 days before cash clears your account. Your forecast should show these delays explicitly. A contract closed in January should not show cash inflow until March or April if the terms are net-60.

Outflows and operational realities: structural expense mapping
Revenue is inherently variable, but your cost structure is largely predictable. Accurate planning means cataloging every direct and indirect expense according to its exact cash timing.
Categorizing direct costs and gross margin mechanics
Cost of goods sold (COGS) covers the direct expenses needed to produce or deliver your product. For a physical goods business, this includes raw materials, packaging, third-party logistics (3PL) fees and assembly labor. For a service or software business, it includes hosting infrastructure, onboarding labor and contractor fees.
Gross margin determines how much capital is left from every dollar of sales to cover overhead:
Gross Margin = ((Revenue – COGS) / Revenue) × 100
When scaling volume, physical goods businesses often face cash flow compression. Suppliers often require deposits weeks before materials ship, which means cash goes out on COGS long before the matching revenue comes in.
Fixed overhead and the reality of capital expenditures
Operating expenses (OpEx) are the fixed and semi-variable overhead required to run the business regardless of sales volume. This includes salaries, office leases, compliance costs, insurance and core software subscriptions.
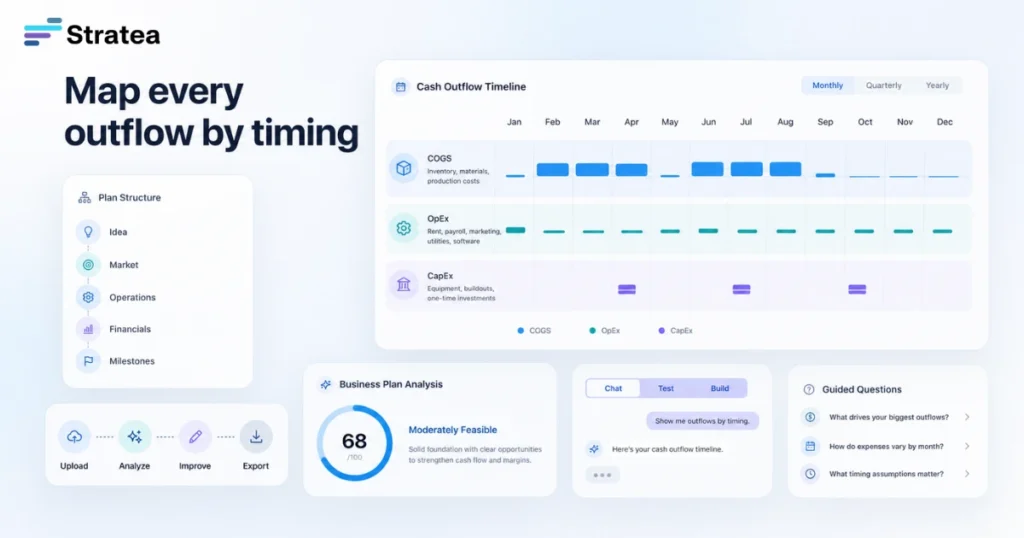
Total Monthly Outflows = COGS (Variable) + OpEx (Fixed) + CapEx (Timing-Dependent)
Capital expenditures (CapEx), such as an industrial mixer or warehouse space, require large upfront cash payments. Your accountant depreciates that equipment over several years for tax purposes, but your cash forecast has to record the full cash drop in the exact month the purchase happens. Missing these large cash drops can break the plan and exhaust runway unexpectedly.
Comparison table: weak vs defensible cash flow forecasts
| Area | Weak cash flow forecast | Defensible cash flow forecast |
| Revenue timing | Assumes cash arrives when the sale is recorded | Maps collections to actual payment terms and cycle length |
| Expenses | Groups costs into broad monthly totals | Separates COGS, OpEx and CapEx by exact cash timing |
| Working capital | Ignores supplier deposits and payment terms | Tracks the full cash cycle from deposit to collection |
| Scenario planning | Shows only a single growth case | Includes target, conservative and pessimistic cases |
| Reviewer readiness | Looks complete but cannot answer follow-up questions | Can be questioned, tested and defended |
Worked example: BlueSage Organics
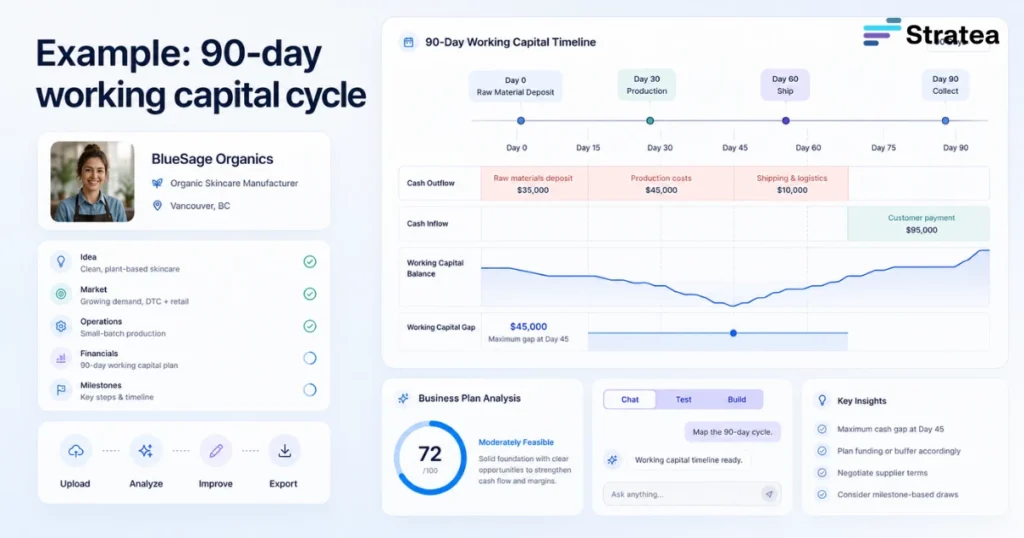
BlueSage Organics is a fictional premium small-batch skincare manufacturer based in the Pacific Northwest, used here to illustrate cash flow forecast planning logic. In this example, the company sells directly to consumers online and wholesale to independent specialty beauty boutiques across the US and Canada.
The operational profile of a skincare manufacturer
BlueSage Organics has an established product line but needs to model its cash position ahead of a major autumn inventory build. The baseline assumptions are built around concrete production metrics:
- Direct-to-consumer (DTC) average order value (AOV): $85 per order
- Wholesale average invoice value: $1,200 per boutique order
- Gross margin profile: 70% on DTC sales, 45% on wholesale orders
- Baseline fixed OpEx: $18,000 per month, covering warehouse rent, core salaries and standard utilities
Mapping the working capital cycle
The challenge for BlueSage Organics lies in its working capital cycle. Raw ingredient suppliers (organic botanical oils, custom glass jars, labels) require a 50 percent cash deposit upon ordering, with the remaining 50 percent due when goods clear production 30 days later.
The wholesale boutique buyers, meanwhile, use net-30 payment terms. That creates a cash mismatch: BlueSage Organics pays for raw components 60 days before a wholesale product ships, then waits another 30 days to collect cash from the retailer.
| Phase in cycle | Day count | Cash impact description |
| Raw material order | Day 0 | 50% cash deposit paid to raw ingredient suppliers. Cash account drops. |
| Production completion | Day 30 | Balance paid to suppliers. Component inventory moves to warehouse. |
| Wholesale order shipped | Day 60 | Product is boxed and delivered to retailers. Invoice issued under net-30 terms. |
| Wholesale invoice settled | Day 90 | Retailer clears the invoice via bank transfer. Cash finally hits BlueSage’s account. |
This timeline shows BlueSage Organics must fund its operational costs for a full 90 days before recovering its initial investment. If wholesale demand doubles, the company needs significant upfront cash reserves to fund production, even while showing strong profitability on paper.
The three-scenario stress test
To protect its cash position, BlueSage Organics built a model to stress-test its assumptions under three scenarios over a six-month period:
| Scenario | Key assumption | Planning implication |
| Target case (15% growth) | Retail sales grow steadily month over month; wholesale partners pay within 30 days | Maintains a comfortable 4-month cash runway throughout the year |
| Conservative case (0% growth) | Retail sales stay flat due to rising ad costs; wholesale accounts take 45 days to pay | Cash balances tighten by October; hiring an extra warehouse worker is deferred |
| Pessimistic case (-20% decline) | Online sales drop 20% on supply delays for core botanical oils; retail partners push payment cycles to 60 days | Cash reserves would hit zero in November without a line of credit |
Because BlueSage Organics modeled the pessimistic track explicitly, the founders saw the November shortfall early and lined up an asset-backed line of credit while the balance sheet was still strong, rather than waiting for a cash crunch to force the decision.
Reviewing your plan: questions for reviewers and lenders
When a business plan goes to external reviewers, the cash flow forecast faces close scrutiny. Lenders at organizations like the SBA in the United States or the BDC in Canada do not just scan the bottom-line numbers. They test the logic underneath to see whether the plan is sustainable.
For deeper structural guidance on building a comprehensive financial framework, review our resource on financial projections for business plan readiness.
What lenders and advisors look for
Accounts receivable realism: if you claim commercial accounts will clear in 30 days but your industry average is closer to 50, reviewers will flag the cash cycle as overly optimistic.
Customer acquisition cost (CAC) scalability: lenders check whether marketing expense scales with the sales curve. Skyrocketing revenue next to flat or falling ad spend rarely holds up.
Direct cost correlation: if raw material expense does not rise with production volume, the model has a structural flaw. Variable cost assumptions must track unit volume.
Validating the feasibility of your financial logic
Before sending a business plan to external partners, run it against a short internal checklist:
- Are inventory purchasing triggers tied directly to upcoming sales volumes?
- Have seasonal demand fluctuations been factored in using the industry’s historical data?
- Is cash runway sufficient to fund payroll even if the primary customer group delays payment by 15 days?
Validating these relationships turns the financial section from a set of hopeful numbers into a plan that can be defended under pressure.
How STRATEA supports cash flow planning
STRATEA is positioned as an AI Planning Assistant, not a static spreadsheet template. Its guided discovery workflow is designed to help founders connect strategic decisions to actual cash timing, so the plan matches supplier agreements, payment terms and market realities rather than an arbitrary growth curve.
A consultant or founder can use guided discovery to surface the assumptions that matter most:
- What is the actual payment collection timeline, not just the stated invoice terms?
- Which expenses are timing-dependent versus recurring?
- How much working capital is needed before revenue arrives?
- Which single assumption, if wrong, breaks the runway first?
STRATEA’s planned and near-term directions, including deeper uploaded-plan analysis and export-ready planning support, should be understood as future-facing unless confirmed as live. The current value is the guided planning structure and assumption review.

FAQ
What is a cash flow forecast and why does a business plan need one?
A cash flow forecast shows when cash enters and leaves the business, not just whether the business is profitable on paper. A business plan needs one because profit and cash rarely move on the same timeline, and lenders and investors want to see that the founder understands the difference.
How is a cash flow forecast different from a profit and loss forecast?
A profit and loss forecast shows revenue minus expenses over a period. A cash flow forecast shows the actual timing of money moving in and out, including deposits, payment terms and financing activity. A business can be profitable and still run out of cash.
How far ahead should a cash flow forecast look?
Many founders build a rolling 12-to-18-month forecast at the monthly level, with weekly detail for the next quarter where cash is tight. The right horizon depends on the funding conversation and how variable the business’s cash cycle is.
What is the biggest mistake founders make in cash flow forecasting?
Assuming revenue and cash arrive at the same time. This shows up most often in businesses with long sales cycles, net-30 or net-60 payment terms, or supplier deposit requirements that are not reflected in the model.
Can AI help build a cash flow forecast?
AI can help structure assumptions, organize cost and revenue drivers, and surface gaps in the logic. It should be treated as a starting point, not verified financial advice, and the underlying numbers should be checked against real pricing, supplier terms and market conditions.
How often should a cash flow forecast be updated?
A monthly update is common for early-stage businesses, with more frequent reviews during periods of rapid growth, seasonal demand shifts or when cash runway is under six months.